






ROAS compares only two numbers: the revenue credited to advertising and the money spent on advertising. It does not know what the product costs you, the shipping, the payment fee, the returns, the discount you gave or whether that sale would have come without the ad. On a product with a 20 percent profit margin, earning four lira of revenue for every lira you spend may sound good, but it means losing money on every sale.
That is why you cannot tell whether the figure in your dashboard is good or bad without comparing it with your own break-even point. Below, we explain how to calculate that point, six situations in which the figure looks good while you lose money, the metrics you should track alongside this ratio and the fixes to make in your campaigns. The numbers in the examples are there to show the calculation; replace them with your own.
What Does ROAS Measure, and What Does It Miss?
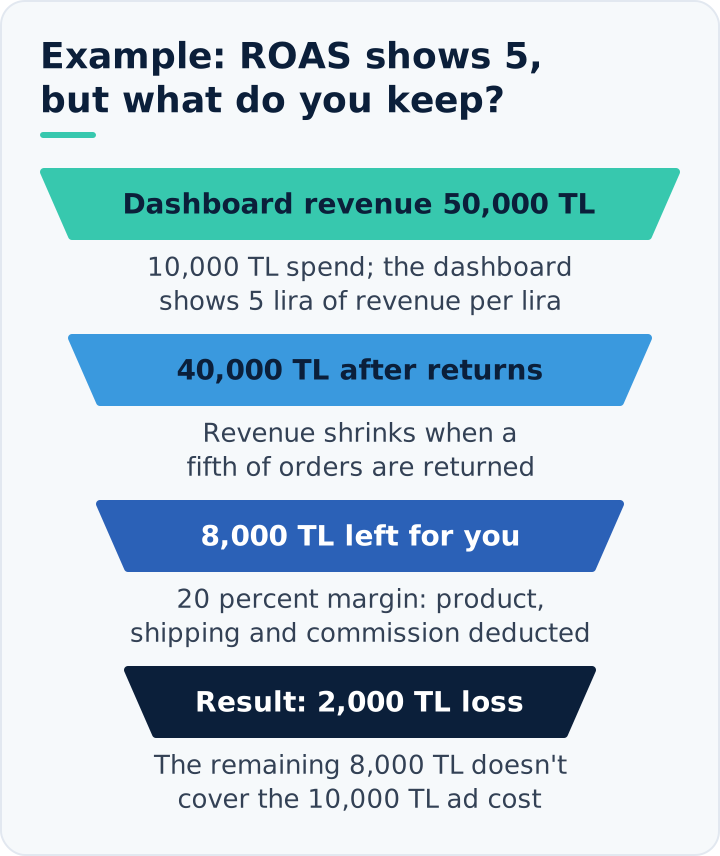
The calculation is simple: you divide the revenue from advertising by the ad spend. If you spent 10,000 TL and made 50,000 TL in sales, the ratio is 5. In other words, every lira you spent brought in five lira of revenue. The abbreviation stands for "return on ad spend"; in Turkish it is also called reklam harcamasının getirisi, or reklam getirisi for short.
The key word here is revenue. Revenue is not the money that stays in your till; there are items you have to pay out of it:
- The purchase or production cost of the product.
- Shipping and packaging.
- Payment and marketplace commissions.
- Tax. In most setups, the amount sent to the ad platform is the sale price including tax.
- Returned orders and the shipping cost of returns.
- Fixed costs such as rent, salaries, software and service fees.
None of these items is included in the ratio. Two businesses see the same ROAS; one makes money and the other loses it. What makes the difference is how much of the revenue stays in the business. You can find the definition of the term and similar metrics in our digital marketing glossary.
The ratio also changes with the date range you look at. Someone who clicks today may place their order a few days later, and that order is credited back to the day of the click. That is why the figure for the last three days often looks lower than it really is, while the figure from a month ago looks settled. When making decisions, look at a period of at least two to three weeks and compare periods of the same length.
Calculate Your Break-Even Point
The break-even point is the ratio at which you neither gain nor lose from advertising. To find it, first calculate what is left to you from a sale after all variable costs except advertising are deducted. This share left before advertising is the contribution margin; the break-even point, that is, break-even ROAS, is calculated directly from it.
Example: on a 1,000 TL sale, the product cost is 550 TL, shipping and packaging 70 TL and the payment fee 30 TL. That leaves 350 TL, or 35 percent of the sale. The break-even point is found by dividing one by this ratio: 1 divided by 0.35 is roughly 2.9. For this product, every ratio below 2.9 is a loss; at exactly 2.9 your gain is zero.
The same calculation gives these results at different profit margins:
- If you keep 50 percent of the sale, the break-even point is 2.
- If you keep 40 percent, it is 2.5.
- If you keep 25 percent, it is 4.
- If you keep 20 percent, it is 5.
- If you keep 10 percent, it is 10.
This list shows why the question "what is a good ratio?" has no single answer. For a cosmetics brand, 3 can be profitable; for an electronics store, even 6 can mean a loss.
Six Situations That Cause Losses Despite a High ROAS
1. The products ads sell most are the ones that earn least
The account-wide ratio is an average. The ad system pushes the product that is easiest to sell, and the easiest product to sell is often the one with the lowest price and the thinnest profit margin. If the average looks like 5 but most sales come from products with a break-even point of 6, the account as a whole is losing money.
2. Discounts push the break-even point up
A discount lowers the price, not the cost. If you give a 20 percent discount on the product above, the sale drops to 800 TL while costs stay at 650 TL; you are left with 150 TL, or 19 percent of the sale. The break-even point rises from 2.9 to roughly 5.3. The ratio of 4 that puts you in profit in a normal period makes you lose money in a campaign week. We covered this calculation in detail in our article on discounts and profitability.
3. Returns and cancellations do not show up in the dashboard
The ad dashboard counts an order the moment it is placed. A product returned two weeks later still appears as a sale in the dashboard. If one in five of your orders is returned, a ratio that shows as 4 in the dashboard is really 3.2. On top of that come outbound and return shipping and the cost of products that cannot be resold.
4. Ads shown to customers who were going to buy anyway
Ads shown to people searching for your brand name and reminder ads shown to people who have added a product to their cart deliver very high ratios, because these people are already about to buy. These campaigns pull the account average up, but part of the sales they bring would have come without the ad. As you see a high ROAS in the dashboard and shift spend to these campaigns, the ratio improves while the number of new customers falls. The additional sales an ad genuinely creates are called incremental sales, and the dashboard ratio does not make this distinction.
5. Platforms' own counting rules
Every ad platform claims sales according to its own rules. It may count an order placed later by someone who only saw the ad without clicking it; two separate platforms may both credit the same order to themselves. If adding up the revenue in the dashboards gives more than the actual revenue in your own records, all the ratios look better than they really are. This counting is determined by each platform's attribution model and conversion window; an order that follows an ad that was seen but not clicked is counted as a view-through conversion.
6. Small volume, large fixed costs
It is possible to spend 5,000 TL a month and get a ratio of 8. That comes to 40,000 TL of revenue; once product cost is taken out, what is left may not even cover one employee's salary. An efficient but small ad account does not carry a business. Keeping spend low because the ratio is high is sometimes the most expensive decision.
When you put the six situations side by side, it is easier to see why each one looks good in the dashboard and which figure shows the reality:
| Situation | Why does it look good in the dashboard? | The figure that shows the reality |
|---|---|---|
| Low-margin products sell a lot | The account average hides products with a high break-even point | Ratio and break-even point by product group |
| Discount period | Revenue grows, but the share left per sale shrinks | Break-even point recalculated at the campaign price |
| Returns and cancellations | The dashboard counts the order the moment it is placed and does not deduct the return | Revenue after returns |
| Branded search and reminder ads | Orders from people who were going to buy anyway are credited to the ads | Cost per new customer |
| Platforms' counting rules | The same order can be counted on more than one platform | Total revenue in your own records divided by total spend |
| Small volume | The ratio is high, but what is left does not cover fixed costs | The amount left after advertising, in lira |
Why Can Trying to Raise the Ratio Lower Your Earnings?
As spend rises, the ratio falls; this is normal. The customers who are easiest to persuade come first, and you pay more for the ones after them. This effect is called diminishing returns. The real question is not where the ratio is highest, but where total earnings are highest.
Example: picture three different spend levels for a store that keeps 35 percent of each sale.
- 10,000 TL spend a month, ratio 6: revenue 60,000 TL, left to you 21,000 TL, 11,000 TL after advertising is deducted.
- 20,000 TL spend a month, ratio 4.5: revenue 90,000 TL, left to you 31,500 TL, 11,500 TL after advertising is deducted.
- 40,000 TL spend a month, ratio 3.2: revenue 128,000 TL, left to you 44,800 TL, 4,800 TL after advertising is deducted.
The highest ratio is in the first line, but the most money is made in the second; on top of that, more new customers are acquired at that level. In the third line, spend has gone beyond what efficiency can support. A business that sets its goal as "raise the ratio" stays in the first line and cannot grow; one that sets it as "grow revenue" goes to the third line and erodes its earnings. The right goal is the amount left after advertising.
How Do Repeat Purchases Change the Calculation?
So far, the calculation has treated each order on its own. If your customers reorder regularly, the picture changes: falling below the break-even point on the first order can be covered by the earnings from later orders. This is common for consumable products such as cosmetics, dietary supplements and pet products.
However, this argument is often used without looking at the data. Before accepting a loss on the first order, pull three things from your own records: what share of new customers order a second time, how many days on average until the second order arrives, and whether the cash you have during that time is enough to keep the business running. If one in ten customers comes back and the second order arrives six months later, the loss on the first order will most likely never be recovered.
The Same Trap in Businesses That Collect Inquiries
In businesses where the sale is not completed on the website, revenue is not sent to the dashboard; cost per inquiry is tracked instead. The trap is the same, only the name changes: a cheap inquiry does not mean a profitable customer. If one campaign brings inquiries at 100 TL and another at 300 TL, the first looks better at first glance. If one in twenty of the first campaign's inquiries and one in five of the second's become customers, the cost per customer is 2,000 TL for the first and 1,500 TL for the second. Here too, the figure in the dashboard and the result in your till diverge, and only your sales records show the reality.
Which Figures Should You Look at Alongside This Ratio?
- The amount left after advertising. Revenue minus variable costs minus ad spend. In lira, not as a ratio. This is the first figure to track every month.
- Total revenue divided by total ad spend. Use the revenue from your own order records, not from the dashboards. This ratio is not affected by platforms counting the same sale twice.
- Cost per new customer. Divide total spend by the number of customers who ordered for the first time that month. If this cost rises as the ratio rises, the ads are not bringing new customers; they are selling to existing ones.
- Revenue after returns. The amount after returns and cancellations are deducted. The gap is large especially in sectors with high return rates, such as clothing.
- Ratio and break-even point by product group. Write each group's ratio next to its own break-even point. The account average hides this picture.
Fixes to Make in Your Campaigns
Separate products by profit margin
Instead of managing all products in one campaign with one target, split high, medium and low profit margin products into separate groups. In the high-margin group you can accept a lower ratio; in the low-margin group you can raise the target or not advertise those products at all. In Shopping campaigns, this split is made with labels added to the product feed; in our Google Ads management work, we build the structure around this split from the start.
Report branded searches and reminders separately
Do not group campaigns aimed at searches for your brand name and at site visitors on the same line as campaigns that reach people who do not know you. When you see the two separately, the real efficiency of the campaigns that bring new customers becomes clear. In most accounts, once this separation is made, the picture looks different from what was expected.
Separate new customers from existing customers
Campaigns that should reach people who do not know you drift over time towards the easiest sale, which is your existing customers. Excluding your customer list from these campaigns or bidding lower for existing customers ensures that spend really goes to new customers. The ratio falls in the first few weeks, while the number of new customers rises.
Check the amount sent to the dashboard
Check what your site sends to the ad platform as the order value: does it include tax, does it include shipping, has the discount been deducted? If the amount sent is larger than it should be, all your ratios are inflated. If possible, also report cancellations and returns back to the system; in some setups it is also possible to send a profit value to the system directly instead of revenue.
Derive your spend limit from earnings
Calculate from your profit margin the most you can spend on advertising for one order, and set your targets accordingly. We explained the steps of this calculation in our advertising budget guide.
Check Your Own Account in Five Steps
- Calculate what percentage of a sale is left after product cost, shipping, commission and the average cost of returns are deducted.
- Divide one by this ratio; the result is your break-even point.
- Compare the ratio of each campaign and product group with its own break-even point.
- For the same period, put the total revenue in the dashboards next to the revenue in your own order records.
- Separate out branded searches and reminder campaigns, then divide the remaining spend by the number of new customers.
These five steps take an afternoon and often show on their own where spend should be shifted. If your report shows only the ratio and never mentions earnings, the first job is to change the report. In our performance marketing work, we manage campaigns not by revenue but by the amount left after advertising; we can work out this picture together with your own figures.
Frequently Asked Questions About High ROAS and Profitability
What is the difference between ROAS and ROI?
ROAS divides the revenue from advertising by the ad spend; ROI, or return on investment, divides the profit left after product, shipping, commission and advertising costs are deducted by the ad spend. Example: if 10,000 TL of spend brought in 50,000 TL of revenue, ROAS is 5. If you keep 35 percent of the sale, you are left with 17,500 TL; once advertising is deducted, profit is 7,500 TL and ROI is 75 percent.
How do you set a target ROAS?
It is set by subtracting the profit margin you want after advertising from the share you keep from a sale, then dividing one by the result. Example: if you keep 35 percent of the sale and want 10 percent of revenue to remain as profit after advertising, the target is 1 divided by 0.25, which is 4. The value you enter in the target ROAS bid strategy in Google Ads should also come from this calculation; the platform asks for this value as a percentage, so for 4 you enter 400 percent.
What is POAS, and how does it differ from ROAS?
POAS is profit on ad spend: instead of revenue, it divides the earnings from ad-driven sales after product, shipping and commission are deducted by the ad spend. That is why the break-even point is 1 for every product, and any value above 1 shows that the ad pays for itself. To track it in the dashboard, the site has to send the ad platform a profit value instead of the order value, so it is more laborious to set up.
Should VAT and shipping be included in the ROAS calculation?
Whether you include them is up to you; what matters is calculating your break-even point on the same basis as the amount sent to the dashboard. If the amount sent to the dashboard includes VAT but you calculated your break-even point excluding VAT, your ratios look better than they really are. Example: if amounts including 20 percent VAT are sent, then for a product where you keep 35 percent of the sale excluding VAT, the lowest value you need to see in the dashboard is not 2.9 but 1.2 divided by 0.35, roughly 3.4. The same rule applies to the shipping fee the customer pays.
What is blended ROAS, or MER?
Blended ROAS is the ratio you get by dividing the total revenue in your own records by the total ad spend across all channels; it is also known as the marketing efficiency ratio (MER). It does not tell you which campaign works, but it shows the overall direction of the business: if the ratios in the dashboards are rising while this ratio stays flat, part of the increase is not real sales but a counting difference.